After years staring at a 1995-style Victron Remote Console crammed into the nav station, I finally built my own dashboard. And it looks better.
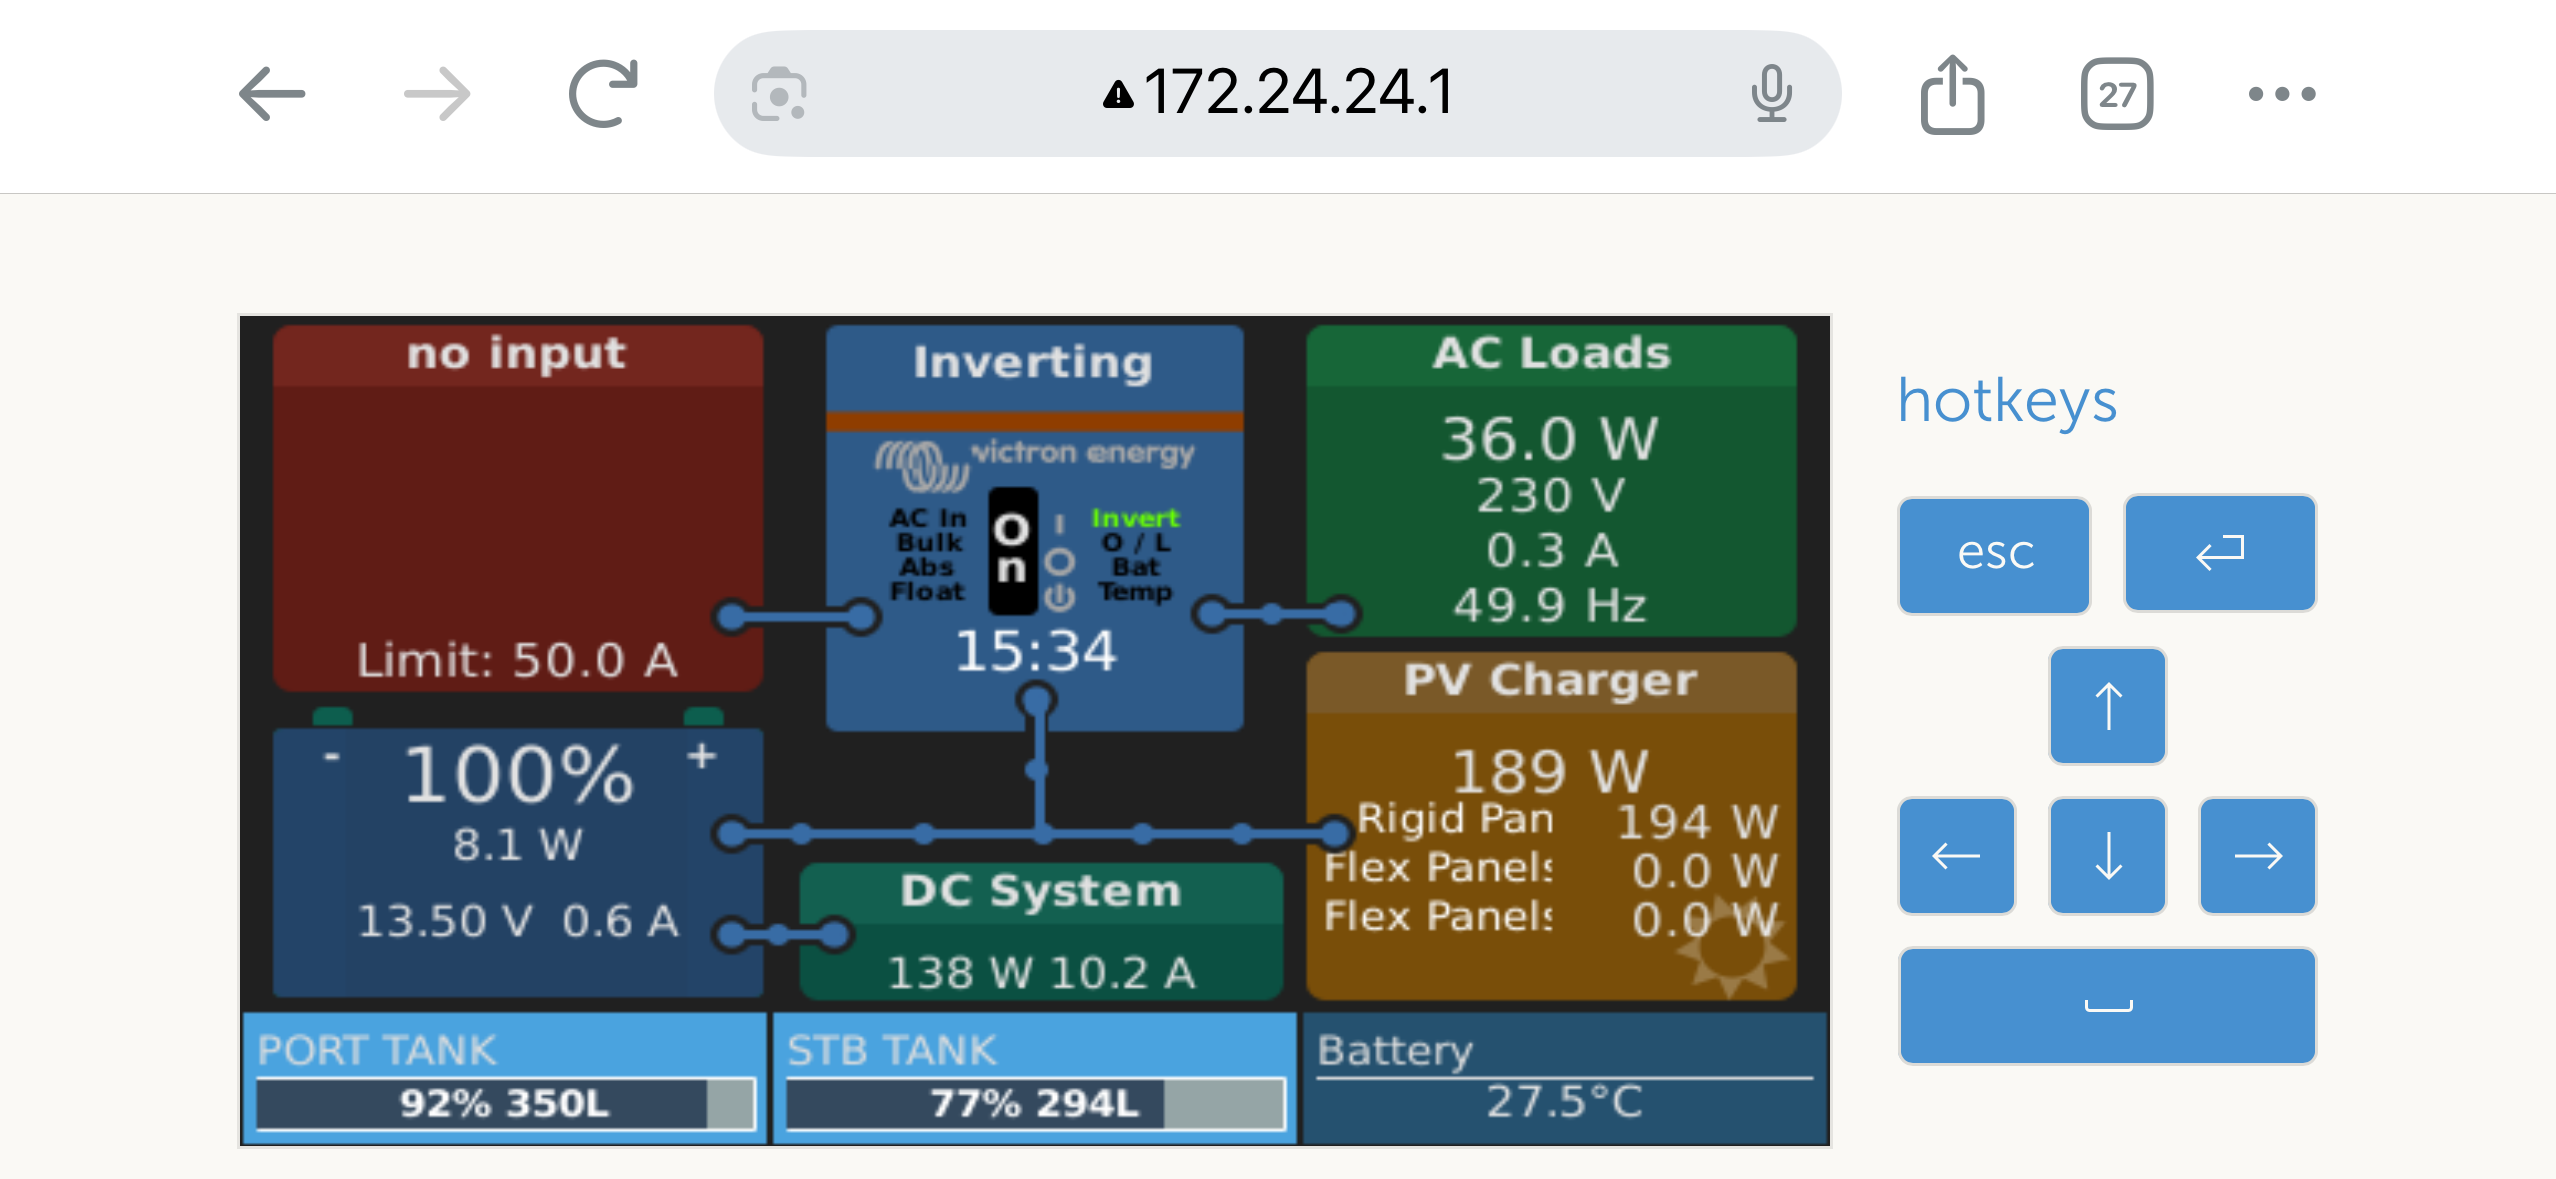
The old display showed battery, solar, and tanks. Fine. But the numbers were small, the interface was designed for technicians, and every time I glanced at it underway I had to lean in and squint.
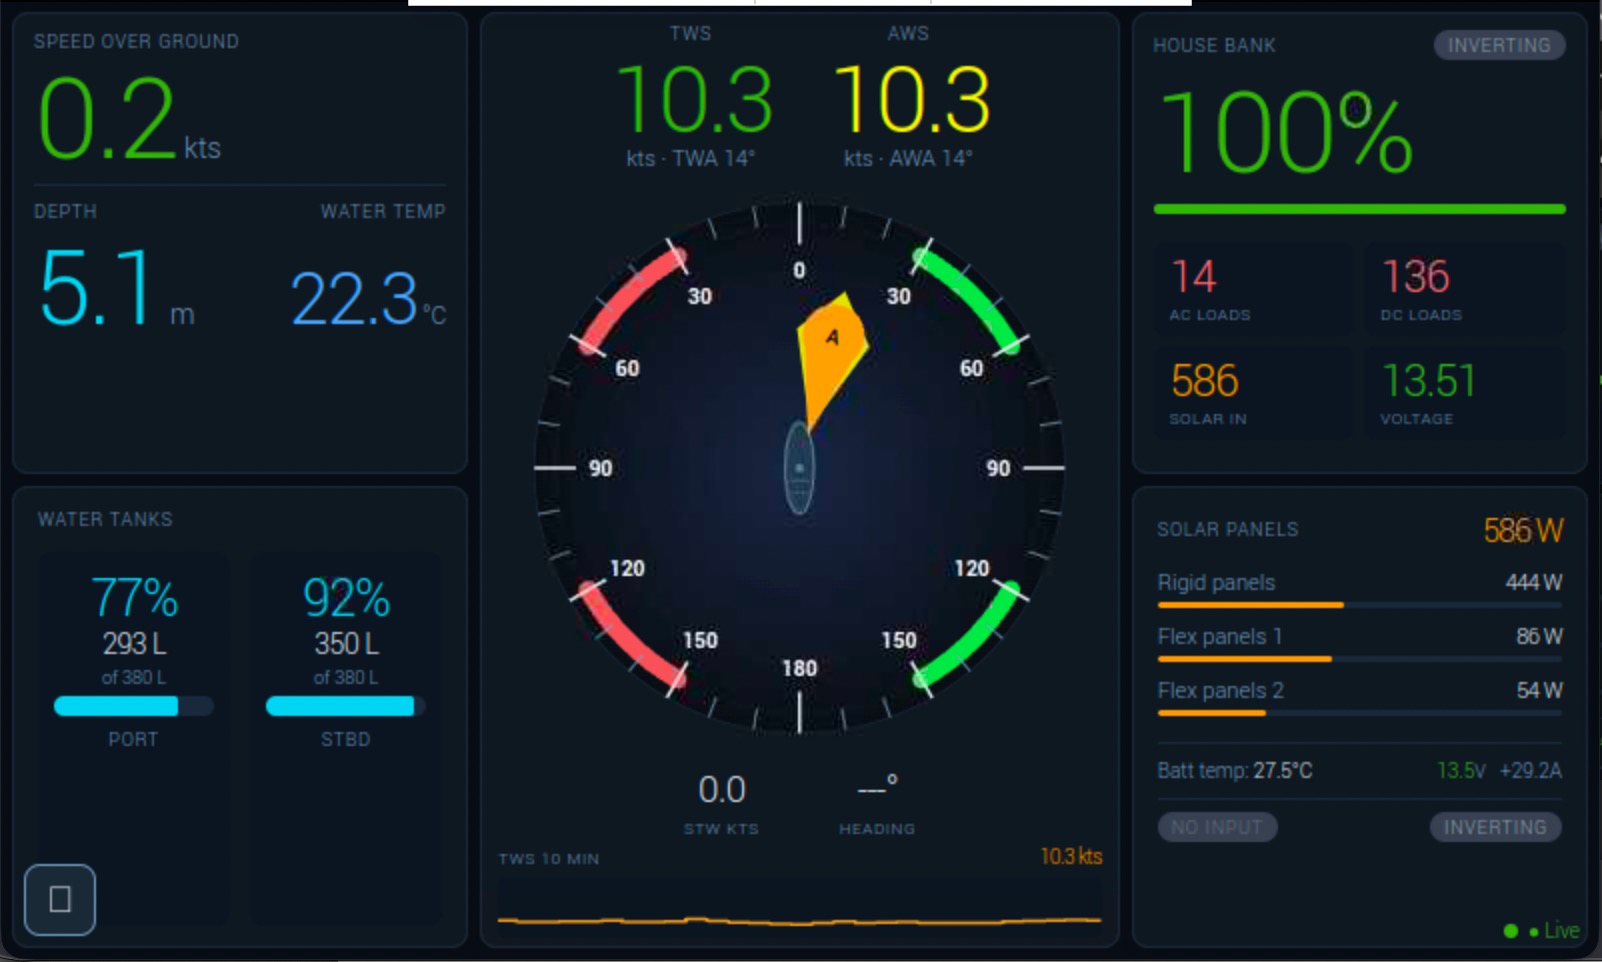
The new dashboard runs on a Raspberry Pi 4 tucked behind the nav station screen. It connects to our SignalK server over WebSocket and shows everything in one glance:
- Speed over ground and depth — numbers large enough to read from the settee
- A full wind rose with apparent and true wind, calculated client-side from the NMEA 2000 data
- A 10-minute true wind speed history graph
- Battery state of charge, solar production from each of our three panel arrays (Rigid Panels 960W, Flex Panels 1 and 2 at 200W each)
- AC and DC loads, inverter status, shore power detection
- Water tank levels in both percentage and liters
Wind data comes from the NMEA 2000 backbone via a CAN HAT on the Pi. Electrical data comes from our Victron Cerbo GX over WiFi via the Venus SignalK plugin and MQTT. True wind is calculated in the browser from apparent wind and boat speed — the same way KIP does it.
The whole thing is plain HTML, CSS, and vanilla JavaScript. No frameworks. No dependencies. No cloud. No subscription. It loads instantly, works offline, and runs forever on a Pi that costs €50.
The code is open source and free on GitHub. If you have SignalK on your boat, you can have this running in an afternoon.